
One-line matplotlib plots and themes for notebooks and scripts.
kx is a small, plain-Python package with .mplstyle themes, palettes and colourmaps. It needs nothing beyond
matplotlib, numpy and pandas and works offline, so it also runs in Kaggle competition notebooks.
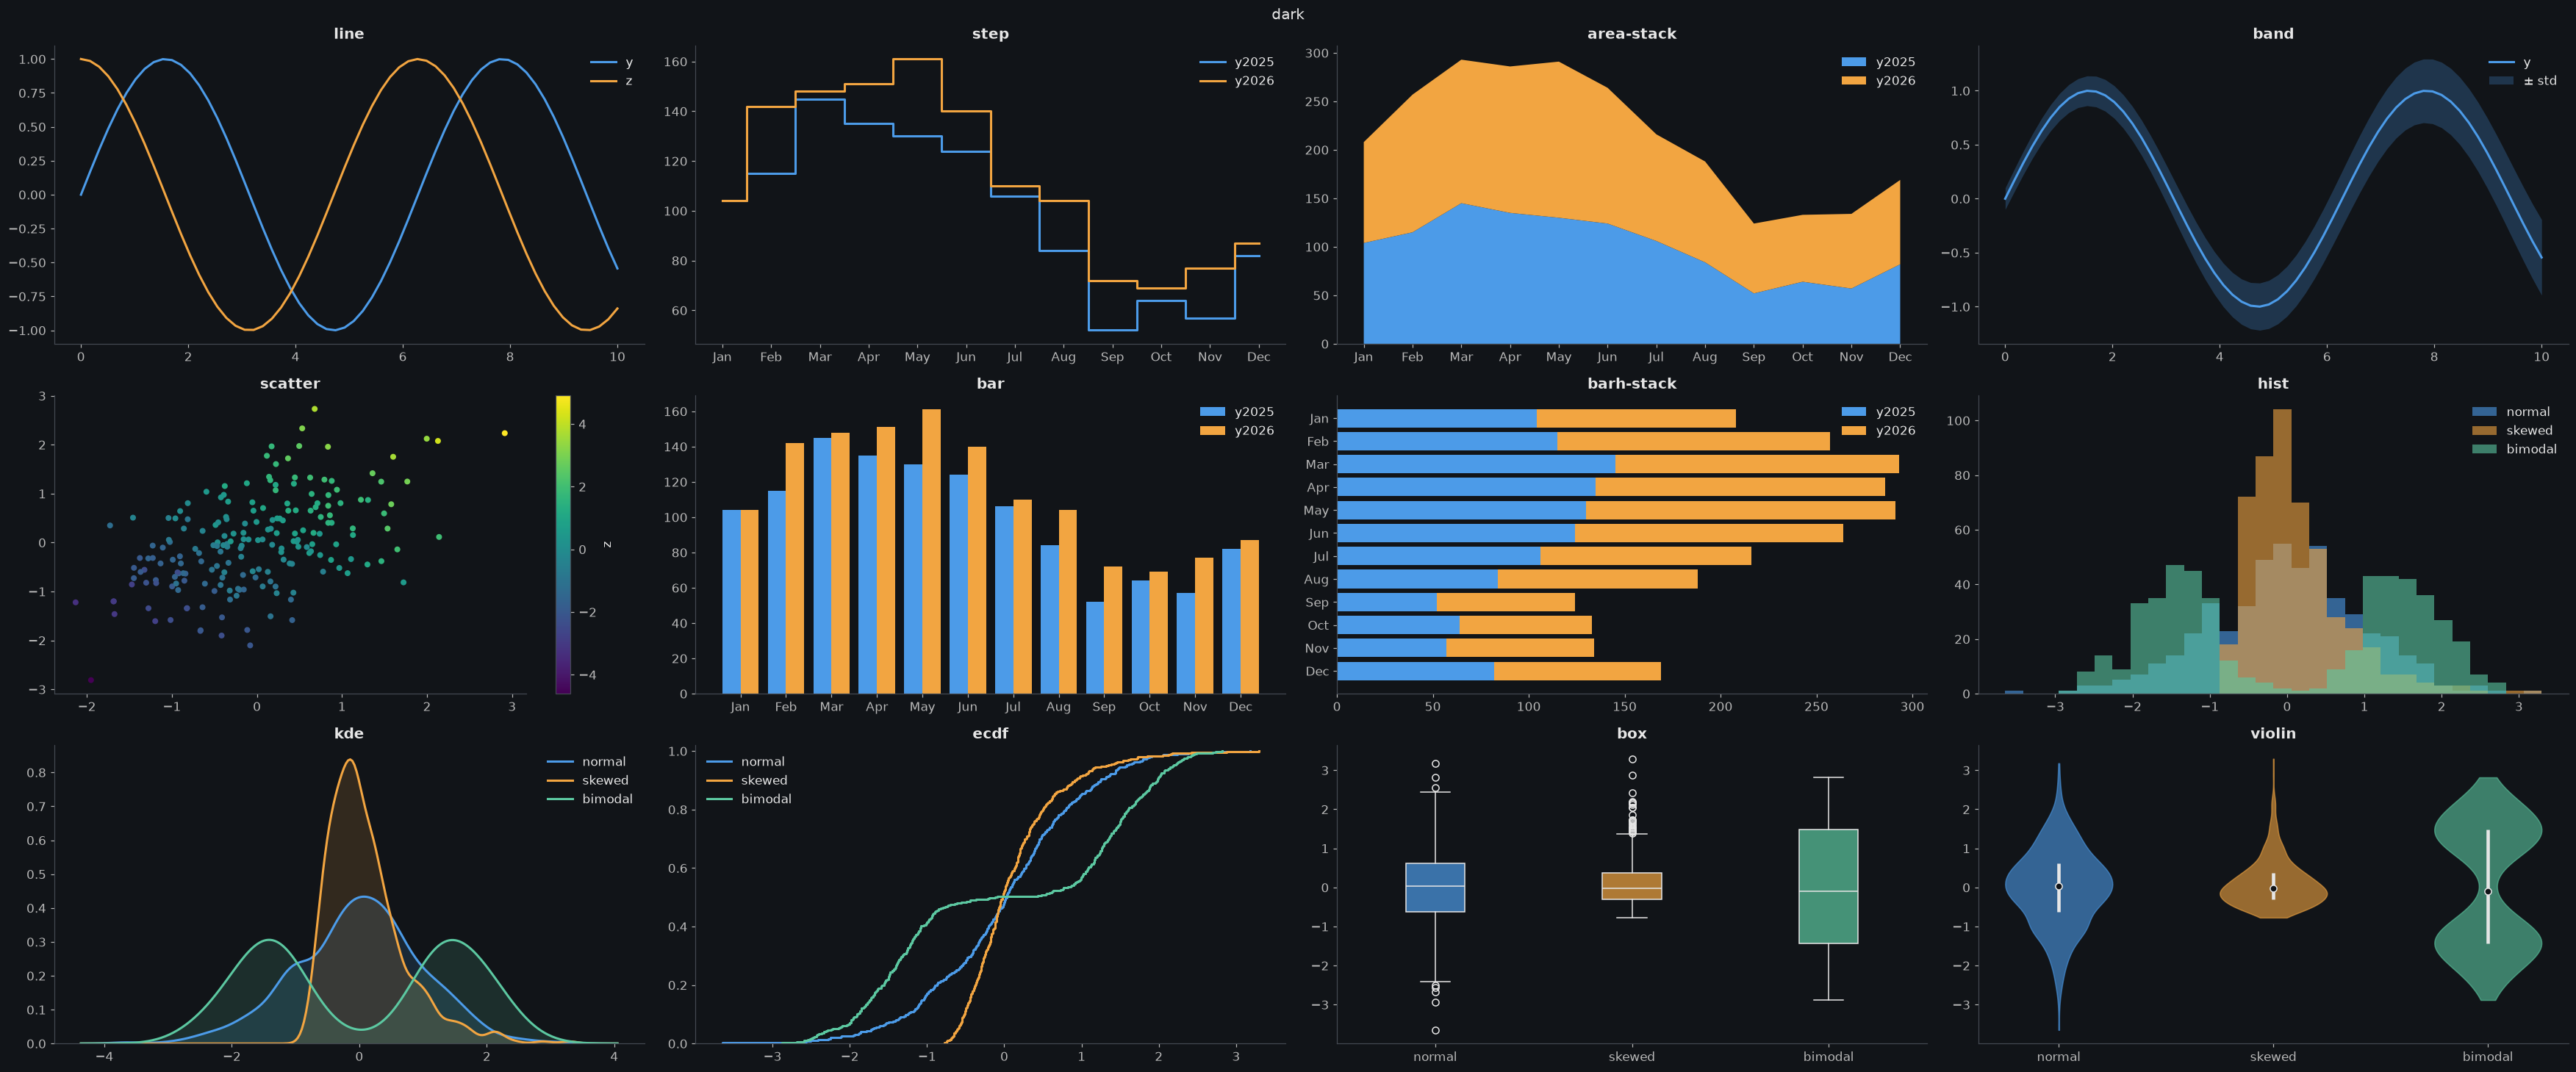
pip install kx-plotimport kx; kx.use('dark')Attach the dataset instead (Add Input → Datasets → vhrabar/kx-plot), then:
import sys; sys.path.append('/kaggle/input/datasets/vhrabar/kx-plot')
import kx; kx.use('dark')kx.use('light', palette='okabe', cmap='cividis') # notebook default: theme, palette, colormap
kx.plot(x, y, z, 'scatter-grid-leg') # spec: kind-theme-flag-...
kx.plot(x, y, 'bar-paper') # a theme in the spec applies to this plot only
with kx.context('paper'): ... # or to every plot in the block
kx.save('fig.png') # to /kaggle/working on Kaggle, else the current folder
for ax, col in zip(kx.grid(3), df.columns): # a figure of 3 panels, a flat array of axes
kx.plot(df, col, spec='hist', ax=ax)
kx.plot(df, 'month', 'y2025', 'bar') # DataFrame columns by name
kx.plot(x, y, 'line', linewidth=3) # other keywords go to matplotlib
kx.plot(df, 'value', spec='kde', by='group') # one density curve per group
kx.plot(df.value, spec='box', by=df.group) # one box per group (also ridge, violin, qq)| Token | Values |
|---|---|
| kind | line step area band scatter bar barh hist kde ridge ecdf box violin |
strip qq count crosstab hexbin heat missing nullmap |
|
| theme | dark light paper science talk poster thesis |
| flags | grid leg legout tight rot wrap logx logy logxy symlogy zero eq pct |
si; per kind: stack norm cum date mk sort ann mean median nocb sym |
|
logc corr all |
stack works with area, bar, barh and hist. norm is a 100% stack for area and a
density (area 1) for hist. cum makes hist cumulative; hist-norm-cum is the CDF.
hist puts every series on the same bins, so the bars line up.
Unknown tokens raise an error instead of being guessed, with the closest valid tokens as a hint.
Everything is inspectable: kx.grammar(), kx.grammar('area'), kx.parse('leg-scatter'), kx.show('dark'),
kx.source('scatter').
kx.load('passengers') is a demo table with numbers, categories and NaNs to try these on.
kx.missing(df)                                     # share of NaNs per column, the most missing on top
kx.plot(df, 'nullmap-sort')                        # where the NaNs are: one pixel row per table row
kx.plot(df, 'heat-corr-ann')                       # correlations of the numeric columns, -1 to 1
kx.plot(df, 'heat')                                # any numeric DataFrame or 2-D array as coloured cells
kx.plot(df, 'pclass', spec='count', by='survived') # rows per category, split by a second column
kx.plot(df, 'pclass', 'port', 'crosstab-norm-ann') # how often each pair of categories occurs
kx.plot(df, 'age', 'fare', 'hexbin-logc') # points per hexagon; with a z, its mean per hexagonheat, missing and nullmap take the whole table and no column names; kx.plot(df[cols], 'heat') for some
columns. wrap breaks long tick labels onto several lines.
rcParams can be overridden in kx.use with __ for dots: kx.use('dark', figure__figsize=(8, 4)).
Every kind, option, flag and config, with its output, is in the Example Usage notebook.
Palettes for kx.use(theme, palette=...), they swap only the colours; a theme's
other cycled properties (such as paper's linestyles) stay.
| Name | Source |
|---|---|
okabe |
Okabe & Ito (2008) |
tolbright tolvibrant tollight |
Paul Tol |
tolhc tolmc |
Paul Tol |
petroff6 petroff8 petroff10 |
Petroff (2021) |
tab10 tab20 tableaucb |
Tableau |
set1 set2 dark2 paired |
ColorBrewer |
ibm |
IBM Design Colors |
kx.palette('okabe') returns the hex codes. A list of colours works too: palette=['#264653', '#e9c46a'].
Colourmaps for kx.use(theme, cmap=...) colour continuous values, such as a numeric z in scatter.
Without cmap, the theme's own default applies.
Add _r to any name to reverse it, e.g. cmap="thermal_r".
| Name | Type |
|---|---|
viridis magma plasma inferno cividis |
Sequential, perceptually uniform |
turbo |
Sequential, rainbow |
blues greys |
Sequential, ColorBrewer |
coolwarm |
Diverging |
rdbu |
Diverging, ColorBrewer |
berlin managua vanimo |
Diverging, dark centre |
twilight |
Cyclic, for angles and phases |
thermal haline deep |
Sequential, cmocean (vendored) |
balance |
Diverging, cmocean (vendored) |
batlow lipari hawaii oslo davos |
Sequential, Crameri (vendored) |
vik roma bam cork |
Diverging, Crameri (vendored) |
romaO |
Cyclic, Crameri (vendored) |
kx.cmaps() lists the ones that are available in the installed matplotlib as those implemented in matplotlib 3.10 or newer
are not vendored.
Released under the MIT License. See LICENSE.
Copyright © 2026 Vedran Hrabar
Vendored palettes and colourmaps keep their own licences; see kx/styles/palettes/LICENCES.md
and kx/styles/cmaps/LICENCES.md.